In this article, Manuel Caldas shares his knowledge on how the power consumption optimization can be done on IoT microcontrollers.
In July 2018, ennomotive launched a challenge that looked for a precise and robust solution to detect and monitor dust in industrial settings. For 6 weeks, 43 engineers from 20 countries accepted the challenge and submitted different solutions. After a thorough evaluation, the solutions that best met the evaluation criteria were submitted by Manuel Caldas, from Uruguay, Maksym Gaievsky, from Ukraine and Sergi Palomar, from Spain.
Power Consumption Optimization: When every milliampere counts
Ever since the birth of the first Arduino board in 2005, the rise of new microcontrollers from the Arduino family and other firms have given people the power of microelectronics. Diverse and innovative projects can be carried out by professionals that do not necessarily have to be technicians or electronics/IT engineers. With just a few elemental electronics and programming notions the horizon expands immensely. If 3D printed is included in the lot, not only prototyping but the completion of final products is also possible.
In many occasions, the system we need to develop will autonomously operate in remote areas powered by batteries. In this particular case, power consumption optimization becomes a fundamental design principle. In this article, and based on a particular fictional example, I aim to give some general ideas for the designer to consider in this kind of situations.
Problem description
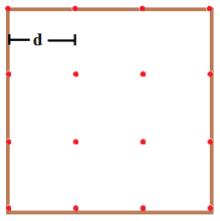
Figure 1: Soil humidity sensor grid.
Let's assume we need to develop an automatic network to monitor soil humidity whose main goal is to optimize a particular crop's irrigation. The network has n measuring points or nodes distributed in a grid, separated by a certain distance as shown in Figure 1. From the measurements of each node and using extrapolation techniques, a soil humidity map can be generated for the given area.
Each node has
n humidity sensors connected to a microcontroller, which has a connectivity module that sends its measurements to a central gateway every
x minutes. Each node is supplied by a
9.0 V battery and 2000 mAh rated capacity.
The challenge here is to minimize the power consumption in every possible aspect since, whenever a battery is out, someone must replace it on the spot. For this reason, the autonomy of every node must be maximized, reducing its power consumption without compromising the quality of the generated humidity map.
In the following paragraphs, the main factors that affect the power consumption of each node will be briefly described.
Step 1: Minimize the number of I/O signals
In a project that requires a microcontroller, we will always find input/output (I/O) signals. From remote sensors that measure one or more parameters coming from one or more signals to process control systems, we must identify in every case which signals are relevant for our problem.
In this case, we must define how many sensors will be in every measuring point or node. One sensor has the benefit of minimizing consumption but is not robust enough; if it fails, that measuring point is gone. This can or cannot be acceptable depending on how dense is our grid. Let's take two cases into account: one and two sensors per node and also assume that each sensor uses
0.5 mA, at 3.3 V on average.
Step 2: Microcontroller selection
We shall consider two options here, the popular Arduino UNO and the smaller Arduino PRO Mini. We are going to assume the consumption rates of these microcontrollers in active and sleep mode shown in Table 1:
| Microcontroller |
Active Mode [mA] |
Sleep Mode [mA] |
| ARDUINO UNO |
45 |
5.0 |
| ARDUINO Pro Mini |
4.7 |
0.9 |
Table 1: Currents in active mode and sleep mode in both microcontrollers.
For the active mode, it is necessary to add the consumption of each sensor (0.5 mA) times the number of sensors (1 or 2).
Step 3: Connectivity
On top of the consumption of the microcontroller and the sensor in active mode, we must add the consumption of the sensor's connectivity module. The consumption depends on the technology to be used for data transmission. Let's say the options are GSM and LoRaWAN.
| Technology |
Consumption Tx [mA] |
Sleep consumption [mA] |
Idle consumption [mA] |
| LoRaWAN |
80 |
0.002 |
1.7 |
| GSM |
90 |
1.0 |
20 |
Table 2: Usual numbers of consumption of the modules LoRaWAN and GSM for Arduino.
Step 4: Code optimization
In this stage, we must define the sampling time, the time between data sending and the time the microcontroller is on active and sleep mode.
Assuming that reading the sensors, finding the average and sending data to the gateway takes 5 seconds, we only have one parameter left (Ts) to quantify its impact within the global consumption.
Results
The following graph shows the battery autonomy days per node, according to the Ts data transmission process for both the optimized and non-optimized design. The first one shows the lower consumption options in steps 2 and 3 (Arduino Mini plus LoRaWAN) and the second one shows the higher consumption options (Arduino UNO plus GSM). In both cases, two sensors per node were used since there is practically no difference in using one or two sensors when it comes to consumption. This is because, most of the time, the system is in sleep mode. It is interesting to note that dependency is not linear. As can be inferred from the graph, our optimized design allows going from 3 to 20 autonomy days for 30 min Ts!
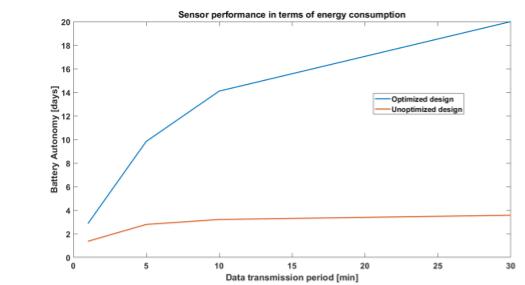
Figure 2: Autonomy days of a 9.0 V and 2000 mAh battery according to the data transmission period (the period between consecutive sending of the sensor reading to the central hub).
Solar Supply
The former design may incorporate a photovoltaic supply system. The main and obvious advantage is the extension of the sensor's autonomy, although it is true that the more components, the more potential sources of failure.
To quantify the effect of including a "solar charger", as these small devices are known in the market, it is necessary to make some assumptions regarding the installation spot. Here we assume that average solar radiation (on a horizontal plane) is 2.0 PSH in winter and 7.0 PSH in summer (usual numbers for mid-latitudes).
Typically, the rated current of the solar chargers for 9.0 V batteries goes from 20 to 30 mA. Assuming 20 mA, we get a module power of 180 mW. This implies that the average daily energy provided by the photovoltaic system is 0.36 and 1.26 Wh in winter and summer, respectively. In the event of sending data every 30 minutes, the sensor's daily energy demand is 0.9 Wh/day.
From a daily energy balance, it is possible to come to the conclusion that autonomy gets a 34-day extension in winter and, during the summer, the daily demand is completely met by solar energy. Of course, the justification of adding more components (solar module, charging control system, etc.) for autonomy reasons depends on the case. I just wanted to quantify the contribution of a photovoltaic supply for usual numbers and situations. A thorough analysis requires a dynamic simulation of the system's transient behavior and, to this end, tools like TRNSYS, Matlab, etc. can be used.
Conclusions
In this article, I intended to prove, using a simple example, the impact of different design parameters on the global power consumption in microcontroller-based devices. When power consumption is a critical parameter, like in the example, it is necessary to bear in mind the aspects already described: optimization of the number of I/O signals, right microcontroller selection, use of the sleep mode of the microcontroller and peripheral equipment (like connectivity modules) and optimization of the program installed in the chosen microcontroller. Besides, the inclusion of photovoltaic supply should be considered. The joint optimization of these factors has a significant impact on the reduction of global power consumption of the devices, which translates into an O&M cost reduction.
Let us know other ways of power consumption optimization in IoT microcontrollers and
explore what ennomotive has to offer.
Join our community of engineers
References
- http://www.home-automation-community.com/arduino-low-power-how-to-run-atmega328p-for-a-year-on-coin-cell-battery/
- Fuente de datos para el módulo LoRaWAN: https://www.youtube.com/watch?v=7nzej8lzwsY
- Fuente de datos para el módulo GSM: https://www.youtube.com/watch?v=OOeOQ-ZRxz8&feature=youtu.be